

🚨GAMES🚨 // The Deliberate Creation of a Self-Limiting Illusion
Limitations of Excluding Unvaccinated Participants in Vaccine Research, Analysis of Yale Data (Preprint), Reevaluating Immune Biomarkers // The Case for Disease Tolerance

This gap makes it difficult to discern cause-and-effect because we lack information on what each person’s immune system looked like prior to any vaccine exposure.
Games have rules that define how they are played!

"Garbage In, Garbage Out" (GIGO).
It means that if your input data is flawed, biased, or low-quality, then your output (results, models, or conclusions) will also be unreliable, misleading, or incorrect—no matter how advanced your analytical methods are.
In the context of the Yale PVS study, this applies because:
If the comparison groups (PVS vs. vaccinated controls) are not well-matched (e.g., differing in dose exposure, health status, or immune predisposition), then the results could be skewed.
Without an unvaccinated baseline, we can’t know if the immune markers observed are truly vaccine-related or just part of broader human immune variability.
The study’s conclusions are only as strong as the quality and completeness of the data used—and if key variables (like prior immune health or infection history) are missing, the interpretation is limited (GIGO).
Even with rigorous statistical modelling, if the underlying data is biased or incomplete, the conclusions might not fully reflect reality—hence, Garbage In, Garbage Out.
NOW, LOOK AT THIS :
Researchers’ Perspective and Study Rationale
It’s important to understand that the researchers intentionally designed the study this way, despite the above limitations, in order to first explore PVS in depth. They have emphasized that their goal is to help patients suffering from this condition, not to undermine vaccination. In fact, physician-scientists have explicitly stated that vaccines save lives and are crucial for public health.
The lead researchers acknowledge the benefits of vaccination (and the rarity of serious vaccine side effects) even as they investigate these puzzling cases of PVS. As one senior author, Dr. Harlan Krumholz of Yale, put it, “It’s clear that some individuals are experiencing significant challenges after vaccination. Our responsibility as scientists and clinicians is to listen to their experiences, rigorously investigate the underlying causes, and seek ways to help.”
Immune markers of post-vaccination syndrome indicate future research directions | Yale News
This sentiment underlines that the study was driven by compassion and scientific curiosity towards an unexplained phenomenon, rather than any anti-vaccine agenda. The study design – focusing on vaccinated individuals only – was a deliberate choice to make the research feasible and focused. The investigators knew this approach would sacrifice some breadth and causal clarity, but it allowed them to start characterizing PVS within a manageable scope. They openly describe this research as an early-stage, hypothesis-generating effort. For example, Yale immunologist Akiko Iwasaki (a co-senior author) noted that the work is in its early stages and the findings need further validation
Immune markers of post-vaccination syndrome indicate future research directions | Yale News
before any firm conclusions can be drawn. In summary, the researchers recognized the limitations of excluding unvaccinated controls, yet chose this path to gather initial data on PVS, with the intent to expand understanding in future studies.
No Pre-Vaccination Baseline or Unvaccinated Comparison
Excluding unvaccinated people from a vaccine-related study means there is no true pre-vaccination baseline group for comparison. Without any vaccine-naïve participants, the research cannot establish what immune markers or symptom rates look like in individuals who never received the vaccine. This makes it unclear how the immune features of the post-vaccination syndrome (PVS) group compare to a normal, unvaccinated state. In other words, we don’t know if the abnormalities seen in PVS are truly out of the ordinary, since there’s no baseline from before vaccination or from unvaccinated people.
Additionally, the absence of unvaccinated controls hinders understanding of background rates of similar symptoms in the general population. For instance, if some immune irregularities or symptoms identified in PVS patients also occur in unvaccinated individuals (perhaps due to other illnesses or random variation), the study design wouldn’t capture that. We lack insight into how often such issues happen in people who never got the vaccine. This context is important: it helps determine whether PVS findings are unique to vaccination or could be confused with other causes. Without this comparison, the results remain narrowly focused on the vaccinated groups, limiting the breadth of conclusions we can draw (Yale Preprint Recorded Patient Experiences, Did Not Demonstrate Vaccines Cause New Syndrome - FactCheck.org). The findings become specific to the studied population (vaccinated people with or without PVS) and should not be generalised beyond that (Yale Preprint Recorded Patient Experiences, Did Not Demonstrate Vaccines Cause New Syndrome - FactCheck.org).
HERE AN EXAMPLE: MEASLES VACCINATION STATUS NOT KNOWN!

Biases and Confounding Factors in a Vaccinated-Only Study
Studying only vaccinated individuals (both the PVS cases and the control group) can introduce several biases and confounders:
Selection Bias: The PVS participants were recruited from an online community of people who believed they had vaccine-related chronic issues. This self-selected group may not represent all vaccinated people. For example, in the referenced study the PVS cohort was mostly middle-aged and female, and they were actively seeking answers for their health problems. This is a specific subset of the vaccinated population, and their characteristics (demographics, health-seeking behaviour, etc.) might skew the results compared to an average vaccinated person.
Differing Post-Vaccine Behaviours: The vaccinated control group (people who were vaccinated but did not report PVS symptoms) likely had different behaviours or experiences compared to the PVS group. Notably, many PVS patients stopped getting further vaccine doses due to their adverse reactions, whereas the control individuals often continued with additional doses without issues. These differences (number of doses received, willingness to continue vaccination, etc.) could correlate with other unmeasured factors, like overall health or exposure risk, making the two groups unequal in ways other than just “having PVS or not.”
Unknown Pre-Vaccination Differences: With no unvaccinated group for comparison, we cannot know if PVS patients had any unique genetic predispositions or health conditions before vaccination that the controls did not. Any pre-existing differences between the groups (e.g. underlying autoimmune tendencies or previous health status) are unknown. Without a general population baseline, it’s hard to tell whether certain immune markers were abnormal only after vaccination or if some people were already inclined to have them. This gap makes it difficult to discern cause-and-effect because we lack information on what each person’s immune system looked like prior to any vaccine exposure.
Immune Profile Context: Both the PVS cases and the healthy vaccinated controls had their immune systems activated by the vaccine (which is expected — all had COVID-19 vaccine-induced antibodies or immune responses, see here for flawed tools). The study compared these two vaccinated groups’ immune profiles, but did not include anyone with a completely vaccine-naïve immune system. As a result, we don’t know how the immune profiles in the study differ from people who were never exposed to the vaccine’s antigen at all. Some immune changes observed might simply be normal post-vaccination effects present in everyone who gets the shot, not unique to PVS. By not having a never-vaccinated comparison, the research can’t pinpoint which immune differences are truly specific to PVS versus which are just typical responses to vaccination that even healthy people would show.
Correlation vs. Causation Questions: Since everyone in the study was vaccinated, the data show that vaccination preceded the syndrome in time — but that alone does not prove the vaccine caused the syndrome or the immune abnormalities. Other factors could be at play. As Dr. Linda Geng noted, “we cannot draw conclusions about the causation of the symptoms reported in this study based on the study design” (Yale Preprint Recorded Patient Experiences, Did Not Demonstrate Vaccines Cause New Syndrome - FactCheck.org). In fact, one known confounding factor in this particular study was that prior COVID-19 infection rates differed between groups: 62% of the PVS patients had antibodies
indicating a past COVID infection, compared to 46% of the vaccinated controls (
New Yale Study on Post-COVID Vaccine Syndrome - Medium) (Researchers Describe Rare Syndrome After COVID Vaccine). This means many PVS cases might have had COVID-19 before or after vaccination, which could contribute to their symptoms or immune markers. Without an unvaccinated control, it’s harder to disentangle whether the vaccine itself, the prior infections, or some combination caused the observed immune differences. In short, the study design makes it difficult to determine if the vaccine directly triggered PVS, or if the vaccine is one of several correlating factors.
Confirmation Bias Potential: Focusing solely on vaccinated individuals might inadvertently amplify a confirmation bias in the research. The investigators were specifically looking for immune differences post-vaccination (which is a logical approach for studying a post-vaccine syndrome). However, this focus could mean they may interpret any unusual finding as vaccine-related. Some of the abnormalities they found — for example, elevated autoimmune antibodies or reactivation of viruses like Epstein-Barr Virus — are not unique to vaccination; such things can also occur in other inflammatory or post-infection conditions. By not having a comparison to people with similar symptoms who never got vaccinated, the study might over-attribute these findings to a vaccine effect when in reality those markers could appear in other syndromes too. Essentially, without broader context, there’s a risk of viewing all results through the lens of vaccination.
It’s worth noting one strength of the vaccinated-only design: it removes vaccination status as a variable, since all participants had the vaccine. This means that when comparing the PVS group to the vaccinated-without-PVS group, any differences found are more likely related to PVS itself (the syndrome) rather than just the effects of being vaccinated. In other words, holding vaccine exposure constant can improve the internal validity of the study – it helps isolate what is unique about PVS under the assumption that a normal vaccine response is present in everyone. This focus allowed researchers to hone in on immune signals that distinguished PVS patients from other vaccinated people, without the data being "diluted" by the obvious differences between vaccinated and unvaccinated immune profiles. However, even the study authors and outside "experts" caution that these results are preliminary and cannot establish causality or broad generalisations (Yale Preprint Recorded Patient Experiences, Did Not Demonstrate Vaccines Cause New Syndrome - FactCheck.org). The findings are internally "valid" for comparing PVS vs. non-PVS vaccinated individuals, but they leave many causal questions unanswered.
Practical Constraints and Trade-offs in Study Design
There are also "practical" and "ethical" reasons that might have led to excluding unvaccinated participants (ADHERING TO THE GAME PLAN!). Including a completely unvaccinated group in a study like this could introduce analytical challenges. Some scientists have noted it might have “added noise” to the data — those unvaccinated individuals would have no vaccine-induced immune responses at all, making them very different from the PVS patients and possibly "complicating" the search for subtle PVS-specific abnormalities. In a small study, a vastly different control group (unvaccinated) could make it harder to pinpoint which immune signals are related to PVS versus which are just due to having been vaccinated or not. By using vaccinated people without symptoms as the control, the researchers made the two groups more directly "comparable" in terms of vaccine exposure.
Another constraint was recruitment "feasibility." Post-vaccination syndrome (PVS) is a very new (in 2025!) and not yet officially recognised condition (Immune markers of post-vaccination syndrome indicate future research directions | Yale News). Designing a study around it means there isn’t an established pool of patients or even a formal case definition to draw from. The researchers had to leverage an existing cohort (the Yale LISTEN study) to find participants. The LISTEN study was originally a platform for people to share experiences of "long COVID" (misdiagnosed!), and it was later expanded to include those reporting chronic symptoms after vaccination (PVS) (Yale Preprint Recorded Patient Experiences, Did Not Demonstrate Vaccines Cause New Syndrome - FactCheck.org). All participants in that platform, by definition, had "COVID" (misdiagnosed!) or a COVID vaccine in their history; it did not enrol people who had neither. So the available dataset naturally consisted of vaccinated individuals – some with PVS and some without. Enrolling a healthy unvaccinated control group would have required a separate recruitment effort outside of this platform, which may have been beyond the scope of an initial study (especially if unvaccinated individuals were less likely to be asked to join a study cantered on vaccine effects and profit).
The case-control format of 42 PVS patients vs. 22 vaccinated controls was a targeted approach given the circumstances (Immune markers of post-vaccination syndrome indicate future research directions | Yale News). Working with a small, self-selected sample can introduce the biases noted above, but it allowed the team to start analysing immune differences right away. Ethically, the researchers also had to be careful: since PVS wasn’t well-defined, they focused on people who self-identified with PVS to ensure they were studying those who genuinely felt they were affected by the vaccine. All these choices reflect trade-offs – the study apparently maximised depth of insight into PVS cases at the expense of breadth of comparisons. The authors and commentators are aware of this, which is why they interpret the results cautiously and do not claim proof of causation (
It’s illustrative to compare this to the prior LISTEN descriptive study (which surveyed PVS patients’ symptoms and experiences without lab tests). That earlier effort simply documented what PVS sufferers reported, again without including unvaccinated people as a control group. It found that common symptoms among PVS patients included fatigue, exercise intolerance, numbness, brain fog, and other issues (Yale Preprint Recorded Patient Experiences, Did Not Demonstrate Vaccines Cause New Syndrome - FactCheck.org). While that provided valuable information about the syndrome, it similarly lacked context from the general population. In both the LISTEN survey and the Yale immunology study, the strength lies in the detailed look at the affected group, but the limitation is a lack of a baseline for how rare or widespread those reported symptoms and markers are in others. Such study designs run the risk of implicitly attributing all observed problems to the vaccine, simply because they only looked at vaccinated individuals. This is why the researchers themselves frame their findings as preliminary and associative rather than conclusive.
The Value of Including Unvaccinated Controls in Future Research
Looking ahead, studies on PVS (or any vaccine-related outcomes) would benefit from including some unvaccinated comparison groups when possible. For example, a future study could include never-vaccinated individuals who have similar chronic symptoms from other causes, as well as healthy unvaccinated controls. This would show whether the immune abnormalities observed in PVS patients are truly unique to those who had the vaccine. If those same markers or symptoms show up in never-vaccinated people with similar complaints, then what seemed unique to PVS might not be vaccine-induced at all. Conversely, if the unvaccinated individuals do not exhibit these markers, it would strengthen the evidence that vaccination could be a key factor in PVS.
Including unvaccinated controls would also provide a clear baseline for “normal” vs. “post-vaccine” immune status. Researchers could directly measure how the immune profiles of vaccinated people (with or without PVS) differ from those of people whose immune systems have never been triggered by the vaccine. This would enhance our understanding of which differences are due to vaccination in general, and which might signal a problem like PVS. In short, having that extra comparison improves the real-world applicability of the conclusions: it grounds the findings in a broader context and helps avoid misinterpretation.
Of course, every study must balance scope with feasibility, and it’s not always easy to include every ideal control group. But whenever feasible, bringing in unvaccinated participants can help producing real science. It adds another layer of evidence to distinguish correlation from causation and to ensure we aren’t missing alternative explanations for the results.
Conclusion
In summary, the exclusion of unvaccinated individuals in this vaccine-related research limits our ability to fully understand and generalise the findings. The study in question provided deep insights into PVS and identified intriguing immune differences, but without a vaccine-naïve baseline, there will always be uncertainty about what those differences mean. Broadening future studies to include unvaccinated controls could dispel that uncertainty and offer a more complete picture of what’s going on.
To be frank, this situation highlights how vaccination studies, by design, end up playing a limited game that can create an illusion of completeness. When a key comparison group is missing, the results can appear to tell the whole story, but really they’re missing context. A more comprehensive approach — even though it requires more effort — would give us greater confidence in distinguishing true vaccine effects from coincidental findings. Maintaining a critical eye on study design like this ensures that research remains both authentic in intent and robust in conclusions, ultimately benefiting public health and true scientific understanding.
WATCH LYNN’S RUNDOWN:

Seriously, make sure you watch this video—it’s worth it:

See here for the meaning of antibodies and T cells
The STAT News article titled "Who to Know: Science Sleuths and Watchdogs Combating Academic Research Fraud" highlights individuals dedicated to exposing misconduct in scientific research. Notable figures include:
Elisabeth Bik: A Dutch microbiologist renowned for detecting image manipulation in scientific publications. She has identified over 4,000 potential cases of improper research conduct and received the 2021 John Maddox Prize for her efforts. en.wikipedia.org
Jennifer Byrne: An Australian cancer researcher who uncovered numerous fraudulent studies in her field. Her investigations have led to multiple retractions and corrections, earning her recognition as one of Nature's "Ten people who mattered" in 2017. en.wikipedia.org+2en.wikipedia.org+2en.wikipedia.org+2
John Ioannidis: A physician and professor at Stanford University, known for his work on the replication crisis in science. His 2005 paper, "Why Most Published Research Findings Are False," is among the most downloaded in the Public Library of Science. en.wikipedia.org
Ivan Oransky: Co-founder of Retraction Watch, a blog that tracks retractions of scientific papers. His advocacy for scientific integrity has shed light on numerous cases of misconduct, prompting discussions on necessary institutional reforms. en.wikipedia.org+2en.wikipedia.org+2en.wikipedia.org+2
The article emphasizes the crucial role these individuals play in maintaining the credibility of scientific research by identifying and addressing fraudulent practices.

»»» STOP HARMING OTHERS! «««

🚨Reevaluating Immune Biomarkers // The Case for Disease Tolerance in Clinical Assessment
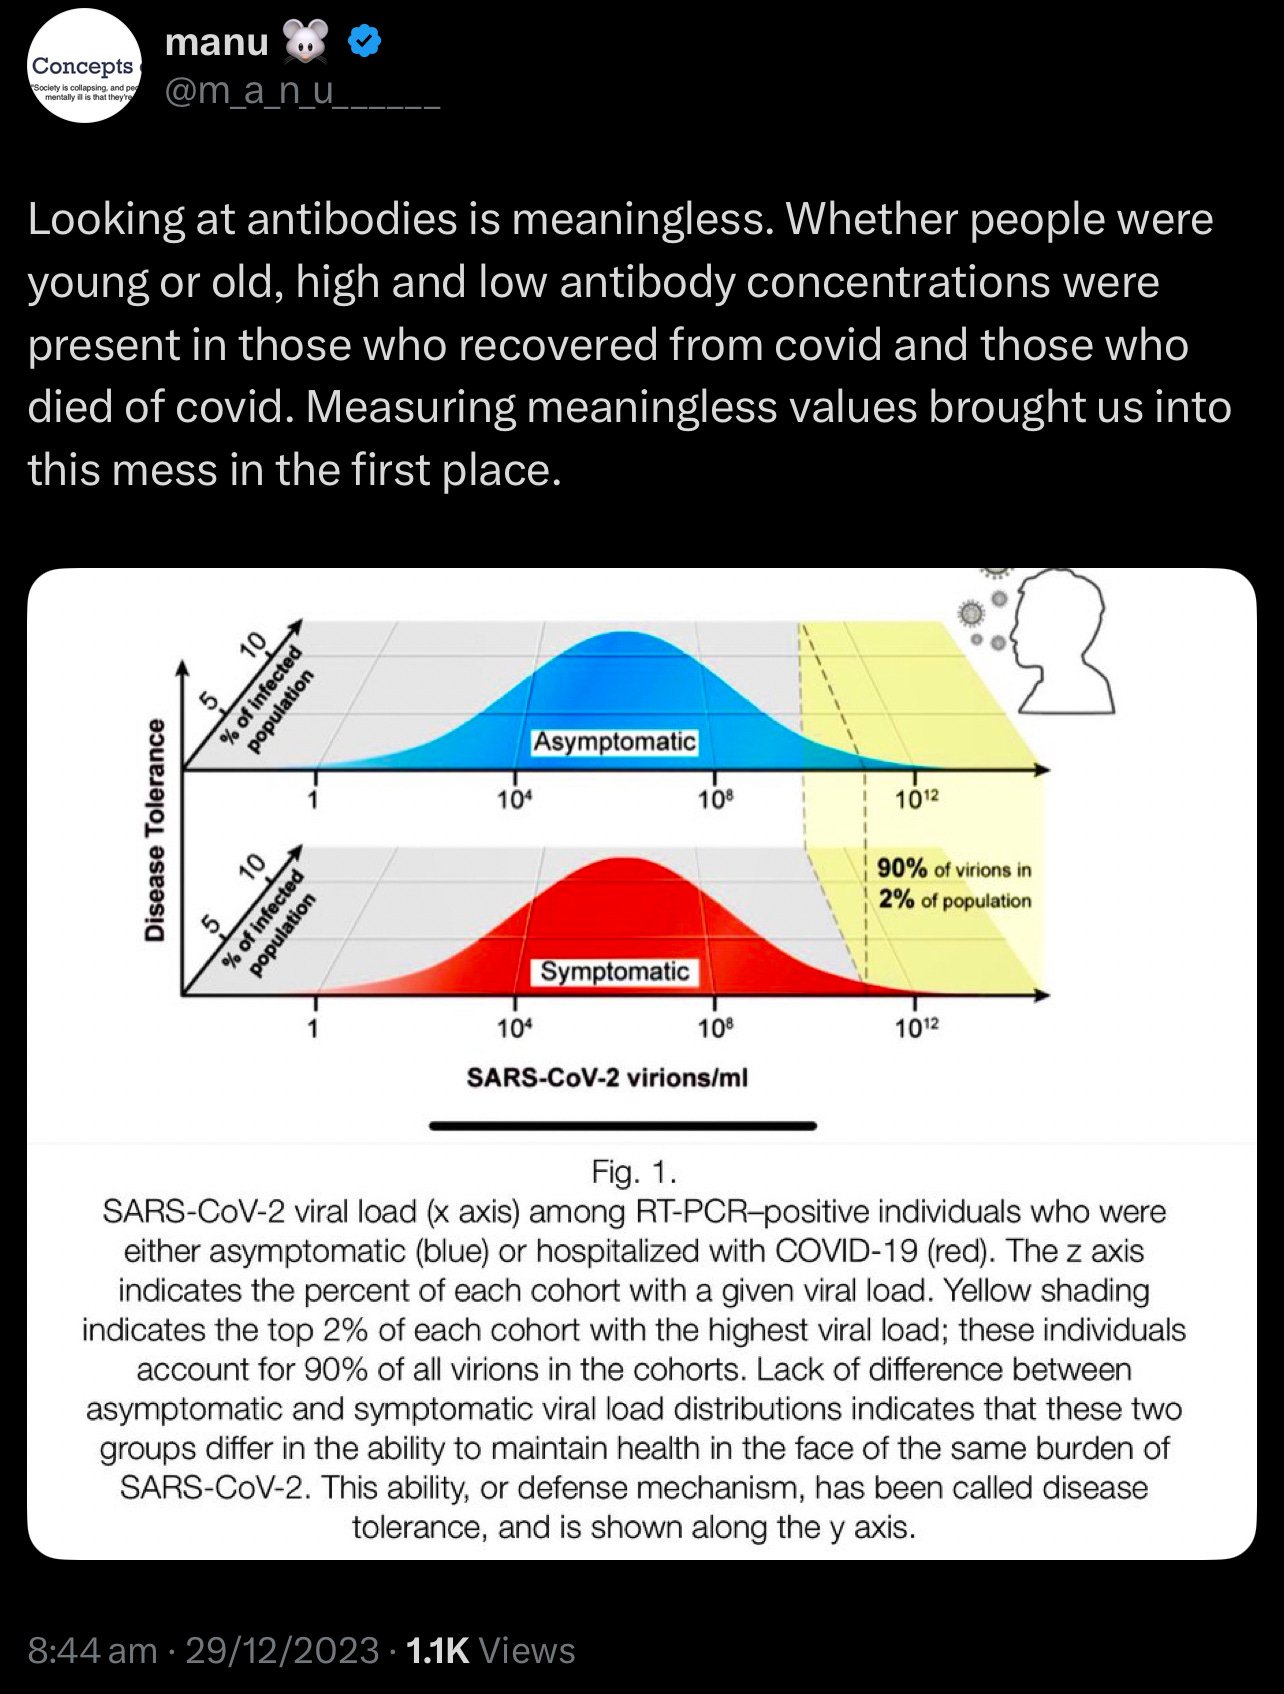
Traditional immunological assessments have long relied on measuring antibody and T cell levels. However, emerging evidence suggests that these metrics alone may not consistently predict clinical outcomes. Studies have shown that antibody and T cell counts can vary significantly among individuals, often lacking a direct correlation with disease severity or patient prognosis. This observation has led to a growing interest in the concept of disease tolerance—the body's ability to minimize tissue damage and maintain internal stability during infections. Unlike traditional immune responses that focus on eliminating pathogens, disease tolerance emphasises mechanisms that control damage, explaining why some individuals experience mild symptoms despite similar pathogen exposures. This paradigm shift offers a more comprehensive understanding of immune competence and resilience.
This challenges the established understanding of the role of antibodies and T cells in immune responses!
Lymphocytes are a type of white blood cell essential to the immune system, and T cells are a subset of lymphocytes. my.clevelandclinic.org
The study by Chen et al. found that lymphocyte counts below 2.99 ×10^9/L on day 7 after sepsis onset were associated with an 85.42% sensitivity for predicting 28-day mortality. However, interpreting lymphocyte counts can be challenging due to the broad physiological ranges observed in healthy individuals. For example, CD4+ T cell counts typically vary from 500–1500 cells/μL, making it difficult to establish definitive thresholds for "normal" or "abnormal" levels. my.clevelandclinic.org
Additionally, factors such as immunosenescence (the gradual decline of immune function with age), stress hormones, and genetic polymorphisms can further complicate the relationship between T cell metrics and health outcomes. my.clevelandclinic.org
Sources:
T cell-mediated Immune response and correlates of inflammation and clinical outcome in COVID-19
Disease tolerance: a protective mechanism of lung infections
Disease tolerance and immunity in host protection against infection
Limitations of Current Immune Biomarkers
Context-Dependent Variability
The same T cell count may confer protection or pathology depending on microenvironmental cues. During malaria reinfection, CD4+ T cells transition from pro-inflammatory cytokine producers to regulators of tissue repair, illustrating that functional status—not merely quantity—determines outcome 2. Similarly, sepsis survivors showed monocyte repopulation by day 7 (AUC=0.834 for mortality prediction), but baseline counts lacked prognostic value 3. This temporal and contextual variability undermines static measurements.
Disconnect Between Pathogen Load and Morbidity
Chronic infections like malaria and tuberculosis persist despite robust antibody and
T cell responses. In mouse malaria models, survival improved not through enhanced parasite clearance, but via myeloid reprogramming that reduced endothelial activation and iron dysregulation 2. These tolerance mechanisms operated independently of pathogen load, highlighting a critical blind spot in traditional biomarkers.
Disease Tolerance as an Alternative Framework
Defining Tolerance in Host Defense
Disease tolerance minimises fitness costs of infection through:
Tissue Resilience: Enhancing cellular stress resistance (e.g., antioxidant upregulation)
Damage Control: Suppressing immunopathology (e.g., regulatory T cell induction)
Metabolic Adaptation: Reprogramming energetics to sustain vital functions 2 4
Unlike resistance, tolerance does not directly reduce pathogen burden, making it invisible to conventional immune assays. However, its clinical relevance is profound: during Plasmodium reinfection, mice lacking tolerance mechanisms succumbed to cerebral malaria despite equivalent parasitemia to tolerant counterparts 2.
Enhance tissue resilience through dietary modifications and reduce exposure to toxins to bolster cellular stress resistance. Adopting an anti-inflammatory diet can modulate inflammatory processes and improve health outcomes!
🚨YALE STUDY (PREPRINT) // Comprehensive Analysis of “Immunological and Antigenic Signatures Associated with Chronic Illnesses after COVID-19 Vaccination”
Study Design and Cohort Composition
Sample Size and Power Considerations: The study compares 42 participants with post‑vaccination syndrome (PVS) to 22 healthy controls. These groups are further subdivided based on prior SARS‑CoV‑2 infection into PVS‑I, PVS+I, Control‑I, and Control+I. Such subdivision results in very small subgroup sizes (e.g., only 11 participants in the Control+I group), which raises significant concerns about statistical power and the reliability of subgroup comparisons. Moreover, no power calculations were reported, leaving it unclear whether the study is sufficiently powered to detect meaningful differences in immune markers or antibody titers.
Recruitment and Decentralized Sampling: Participants were enrolled through the decentralized LISTEN study. Although this design improves accessibility, it also introduces variability in biospecimen collection, symptom reporting, and assay standardization across multiple sites. The lack of detailed quality control measures—such as inter-lab calibration or centralized data harmonization—may contribute to inconsistencies in the data.
Data Collection and Symptom Reporting
Subjectivity in Symptom Reporting: The diagnosis of PVS relied heavily on self-reported symptoms (e.g., fatigue, brain fog, neuropathy) and validated PROMIS‑29 scores. However, the subjective nature of these reports introduces recall bias, as evidenced by the high rate of reported symptoms (e.g., 85% of PVS participants reporting excessive fatigue) without corroboration from objective measures like actigraphy or cardiopulmonary testing. This subjectivity can also affect the performance of machine learning models that attempt to derive clusters from such data.
Symptom Clustering: Supplementary Figure S1 illustrates the use of hierarchical clustering on self‑reported symptoms to define groups within the cohort. While this approach offers insights into potential subtypes of PVS, the reliance on subjective data means that the resulting clusters could conflate psychosocial factors with underlying biological mechanisms.
Statistical and Analytical Methods
Multiple Testing and p‑Value Adjustments: The analysis employs non‑parametric tests (e.g., Mann‑Whitney U and Kruskal‑Wallis) to compare over 20 immune cell populations, various PROMIS‑29 domains, and antibody titers between groups. However, the study does not describe the use of p‑value adjustments (such as Bonferroni or false discovery rate corrections), significantly increasing the risk of Type I errors. This omission weakens the robustness of reported differences, such as those in memory CD4 T cells and circulating spike protein levels.
Effect Size Reporting: Key findings, including the elevation of circulating spike protein in PVS participants and the differences in anti‑spike antibody titers, are presented without clear effect size estimates. Without quantifying the magnitude of these differences, it is difficult to assess their biological relevance, particularly given that some differences might be confounded by other factors like vaccine dose number.
*FOR CLARITY:
Key Issue:
Bonferroni was only used in specific post-hoc tests, but not in all comparisons.
A large number of variables (176+) were analyzed without Bonferroni, making some findings statistically fragile.
The study applied some multiple comparison corrections, but not consistently across all statistical tests, which could inflate false-positive rates in certain areas.
The Yale PVS study explicitly states that:
547 independent variables were tested initially without multiple testing corrections (e.g., Bonferroni or Benjamini-Hochberg) using Mann-Whitney U tests.
"Non-parametric Mann-Whitney tests were implemented without multiple testing corrections to look for differences in distributions of 547 independent variables including GHVAS scores, circulating modulator levels, anti-SARS-CoV-2 antibody titers, and autoantibody scores within both the PVS-I and PVS+I subgroups."
A subset of 193 variables was later analyzed in the machine-learning phase, but Bonferroni correction was not applied.
"A total of 193 variables were included [in the machine learning phase]. Bonferroni correction was not applied during this step."
Why This Matters:
A large number of variables were analyzed without Bonferroni correction, making some findings statistically fragile.
Increased False Positive Risk → Testing hundreds of variables without strict correction means some findings may be statistically significant just by chance.
Inconsistent Statistical Adjustments → While Benjamini-Hochberg (FDR) and Bonferroni-Holm corrections were used in some post-hoc analyses, they were not applied uniformly across all statistical tests.
Potentially Fragile Results → Since no multiple testing correction was applied to the 547-variable screening step, some significant findings may not hold up under stricter corrections.
How Did the Study Perform p-Value Adjustments?
Benjamini-Hochberg correction (False Discovery Rate, FDR)
Used for Mann-Whitney U tests and Kruskal-Wallis tests.
Controls for false positives but is less strict than Bonferroni.
Bonferroni-Holm correction
Applied in Dunn’s post-hoc tests after Kruskal-Wallis comparisons.
Less conservative than Bonferroni but still adjusts for multiple comparisons.
These adjustments reduce false positives (Type I errors) but are not as strict as standard Bonferroni.
Bonferroni-Holm vs. Standard Bonferroni—Why It Matters:
Standard Bonferroni Correction:
Divides α (e.g., 0.05) by the number of comparisons (m).
Extremely strict → Greatly reduces false positives but increases false negatives.
Bonferroni-Holm Correction:
A stepwise Bonferroni method → Adjusts p-values in order instead of applying the same cutoff.
Less strict than standard Bonferroni, meaning more findings remain significant.
Still allows more false positives than standard Bonferroni.
Final Verdict:
Bonferroni-Holm is not strict enough when testing hundreds of variables.
The study already skipped corrections in the first stage, meaning stricter adjustments should have been applied later.
Bonferroni should have been used in at least some key analyses to filter out false positives more effectively.
Machine Learning Implementation
Methodological Details and Overfitting Concerns: The study highlights the use of machine learning techniques (such as clustering methods likely employing PCA or t‑SNE) to analyze symptom profiles and immune features. However, methodological details—including the feature selection process, hyperparameter choices, and cross‑validation strategies—are sparse. This lack of transparency increases the risk of overfitting, especially when applied to small and imbalanced cohorts. For example, clustering performed in a sex‑segregated manner may inadvertently inflate group differences if not rigorously validated.
Confounding Factors and Bias
Temporal Confounding in Spike Protein Detection: There is a substantial disparity in the timing of sample collection between groups: PVS participants were sampled at a median of 585 days post‑vaccination compared to 199 days for controls. Since circulating spike protein levels are known to decline over time, this 386‑day gap is a significant confounder. Lower spike levels in controls could simply reflect the longer interval since vaccination, rather than a PVS‑specific effect.
EBV Reactivation and Causality: The study reports a higher frequency of Epstein‑Barr virus (EBV) reactivation in PVS participants based on serostatus. However, EBV antibodies were measured at a single time point, which does not allow differentiation between recent reactivation and latent infection. Moreover, EBV reactivation is known to occur in various states of immune dysregulation, so it remains unclear whether it is a causative factor or a downstream effect of PVS.
Vaccine Heterogeneity: Participants in the study received different vaccine platforms (mRNA and adenoviral), yet the analysis predominantly pools these cases together. This approach overlooks potential platform‑specific immune responses—for instance, the prolonged spike production associated with mRNA vaccines versus the persistence of adenoviral vectors—which could differentially influence the risk of PVS.
Data and Technical Precision
Assay Reproducibility and Missing Data: The serological assays (e.g., Elecsys® anti‑SARS‑CoV‑2) and spike protein quantification methods are briefly referenced but lack detailed technical validation (such as intra‑assay coefficients of variation). Furthermore, while two PVS participants were excluded due to immunosuppression, the handling of other missing data (such as unreported index vaccines in a few cases) is not described. These gaps could introduce bias, favouring complete‑case analyses that might not represent the full cohort.
Interpretative Limitations
Causality versus Correlation: The study identifies associations—such as reduced CD4 T cells and elevated TNFα+ CD8 T cells in PVS—but its cross‑sectional design prevents any conclusions about causality. Reverse causality is also possible, as chronic inflammation in PVS could lead to the observed immune cell alterations rather than being caused by them. Longitudinal studies tracking immune trajectories before and after vaccination are needed to clarify these relationships.
Overlap with Long COVID: Although the authors note that symptoms of PVS overlap with those of long COVID, there is no direct comparison between the two cohorts. The immune signatures observed in PVS (e.g., elevated TNFα+ CD8 T cells) mirror those reported in long COVID, leaving open the question of whether PVS is a distinct clinical entity or a vaccine-triggered subtype of long COVID.
Conclusion and Recommendations
While the study provides preliminary insights into immune dysregulation associated with post‑vaccination syndrome, several methodological and analytical limitations hinder the strength of its conclusions. Key recommendations for future work include:
Cohort Expansion and Power Calculations: Increasing the sample size and ensuring balanced subgroup compositions are essential to enhance statistical power and reduce the risk of overfitting in machine learning applications.
Rigorous Statistical Corrections: Implementing and clearly reporting p‑value adjustments (e.g., Bonferroni or false discovery rate corrections) would reduce the likelihood of false positives.
Standardized Data Collection: Enhancing quality control across decentralized sites and incorporating objective measures alongside self‑reported symptoms would improve data reliability.
Detailed Methodological Transparency: Providing comprehensive details on machine learning methodologies—including feature selection, hyperparameter tuning, and validation strategies—would bolster the reproducibility of the findings.
Addressing Confounding Factors: Future analyses should adjust for temporal differences post‑vaccination and stratify by vaccine type to better isolate PVS‑specific immune signatures. Additionally, longitudinal studies are needed to establish causal relationships.
Given the space constraints typical of preprint publications, it's plausible that the authors possess additional data and methodological details not fully disclosed in the initial manuscript. This supplementary information could encompass power calculations, quality control protocols for decentralized data collection, assay validation specifics, and comprehensive descriptions of their machine learning methodologies. Engaging directly with the authors may yield further clarifications, and it's anticipated that subsequent revisions or peer-reviewed publications will address these aspects more thoroughly.
Correspondence can be addressed to:
leying.guan@yale.edu, harlan.krumholz@yale.edu, akiko.iwasaki@yale.edu
Sources:
https://www.medrxiv.org/content/10.1101/2025.02.18.25322379v1.full.pdf


SOURCE:
https://x.com/HouseLyndseyRN/status/1896315761347698812

They would never make the mistake of providing uncompromised data—there’s too much at stake!
But let’s take a step back: how is COVID-19 even identified in these datasets? The selection bias starts right there—with how infections are classified. Once you accept their framework, you’ve already lost.
You can run calculations across the entire dataset, and it will always favour vaccination, because the dataset itself is structured to produce that result. The key? Overrepresentation of favourable data.
---------------------------------
Selection Bias: The Core Issue
- Individuals who had no major adverse events after vaccination were more likely to continue to additional doses.
- Those who experienced adverse reactions often stopped—leaving higher-dose groups artificially "healthier."
- Fewer infections in higher-dose groups were overrepresented in the whole dataset.
This isn’t just a coincidence—it’s selection bias baked into the study design.
---------------------------------
Effect Sizes and Skewed Associations
- IgG4 levels in the high-dose group were more than double those in the low-dose group (~31 mg/dL difference).
- Global Health (GHVAS scores): Each additional dose was linked to ~10 points higher health score (0-100 scale).
- Regression models show a strong positive link between dose count, self-reported health, and IgG4 levels.
🚨 But causation is a problem:
- PVS participants (those with health issues post-vaccine) stopped at lower doses.
- Their lower dose count reflects poor health.
- The observational effect is large and statistically significant, but heavily influenced by study design.
---------------------------------
🚨The Bigger Question: Biomarker Manipulation?
- Consider this possibility: biomarkers can be triggered and adjusted per dose count.
- First dose, booster, next booster… does the vaccine itself induce biomarker responses artificially?
- If biomarker elevation isn’t directly linked to disease status, but still changes with dose count, that suggests a separate mechanism at play.
- Could it be that these biomarkers don’t reflect natural immunity but rather an engineered response?
More doses → More biomarker activation → Stronger dataset justification.
Once you understand how selection bias is built into the system, you realize that the data will always "prove" what they need it to prove.
🚨 It’s reproducible not because it’s true, but because the system ensures it is!
.
🚨🚨This is a big issue in science🚨🚨
The tools used to gather data are imprecise and therefore render the findings meaningless!
My short article highlights serious concerns about relying on antibody response data for regression and model fitting. https://x.com/m_a_n_u______/status/1894725032565473398?s=46&t=8lKsot7pcdmGUGcY7FMq6Q
An R² value of 1 and an extremely low sum of squares might not indicate genuine model robustness but could instead be artifacts of overfitting or inherent limitations in the dataset.
In the Yale study, antibody responses were modelled using asymmetrical sigmoidal five-parameter least-squares fits (resulting in an R² of 1) and supplemented by linear models that identified significant predictors. However, if the underlying antibody response data is inherently unreliable, then even these impressive statistical indicators lose their meaning. This raises important doubts about the precision and generalisability of the model validation process.
This underscores a critical point in scientific research: even when advanced statistical tools are applied, if the data acquisition methods are imprecise, the results—and any conclusions drawn—are rendered meaningless!